Shop Solver
Plot
Command path: File->Plot...
This command opens a new window and
draws the geometric definitions saved in memory. The 2-dimensional
geometrics that are drawn include points, lines, circles, ellipses, hyperbolas and
patterns. You can also open a plot by typing Ctrl+L at any time, or by right-clicking in the geometric definitions list and select "Plot" in the pop-up menu.
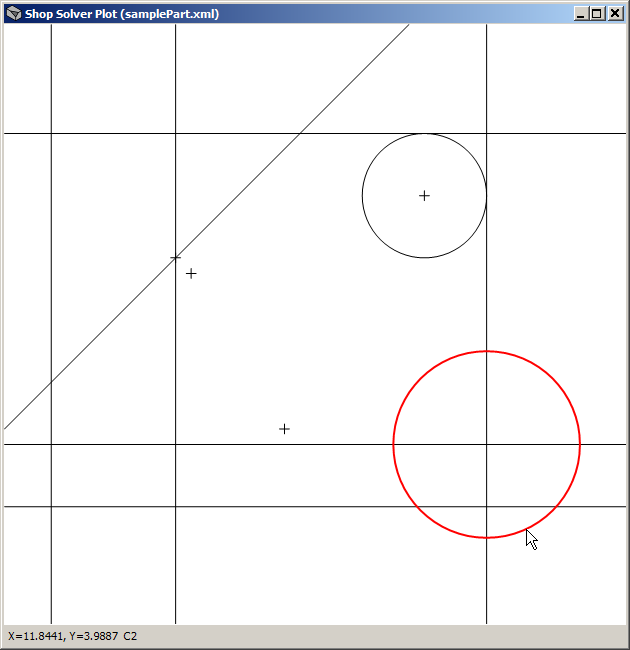
A sample plot is shown below.

The
window's client area displays the plotted geometrics. The status
bar at the bottom shows the real-world X and Y location of the mouse
pointer and the name of the currently selected geometric. A
geometric is selected by hovering the mouse pointer over the outline of the
geometric. Geometrics are drawn in red when selected.
Use
the mouse wheel to zoom the image in and out. The mouse wheel
zooms the image around the mouse pointer so that the location under the
pointer stays the same. You can also use the "+" (plus) and "-"
(minus) keys on the keyboard. However, in this case the zoom
occurs around the center of the entire plot's
extents.
Pan
the image in any direction by dragging it with the mouse pointer while holding
down the left button. You can also pan using the arrow keys on
the keyboard.
Use the "Home" key on the keyboard to zoom the image to its maximum extents, or click the right button on the mouse.
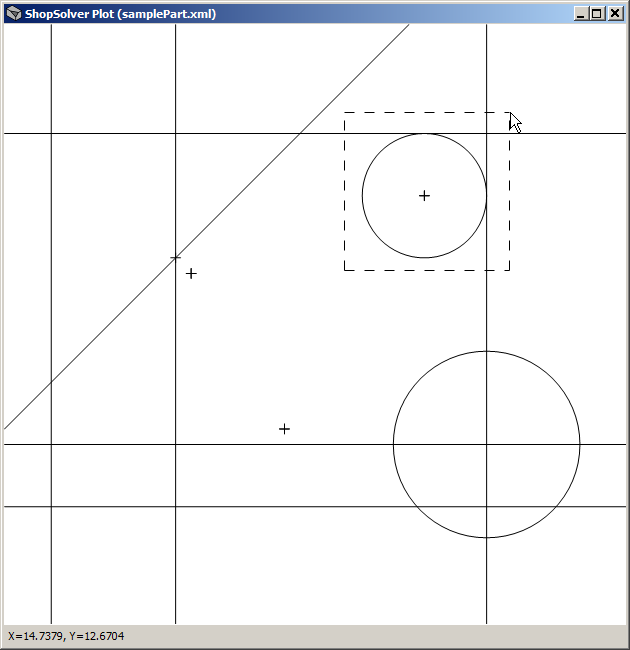
To select an area to zoom:
- Hold down the shift key on the keyboard.
- Click and hold the left button on the mouse.
- Move
the mouse pointer in any direction. A dashed rectangle will be
drawn. Continue to move the mouse pointer until the desired area
is surrounded by the selection rectangle.
- Release the left button on the mouse.
- The selected area will zoom to fill the plotting window.


